Free Sample Lesson: Decision Tree Modeling in SPSS Modeler
Learn when to use a decision tree, how the visual workflow is structured, and how to explain the result clearly.
Compact Guided Analysis
What you will complete
This free lesson follows one manageable classification analysis from the project question through SPSS Modeler, output interpretation, and report writing. It demonstrates the complete learning process without duplicating the algorithm comparisons and advanced diagnostics in the full Decision Trees module.
Recognize when a decision tree fits a classification problem.
Build one defensible C&R Tree workflow in SPSS Modeler.
Read a tree diagram, terminal nodes, predictor importance, and held-out classification results.
Choose the evidence that belongs in a report.
Write a cautious results paragraph without making causal claims.
Example Scenario
Predict whether a traveler will make a purchase
Suppose a travel organization wants to predict whether a traveler will make a purchase. The target field is Purchase, with categories Yes and No. Candidate inputs include travel purpose, airline status, age, arrival delay, flight distance, and price sensitivity.
Project question: Which patterns help distinguish likely purchasers from non-purchasers, and how accurately does the model classify new cases?
This is a supervised classification problem because the target is known in the historical data. The model may identify useful predictive patterns, but it cannot establish that a predictor caused a purchase.
Core Concepts
How a decision tree turns data into rules
Root node
All eligible cases before the first split.
Split
A predictor and condition used to separate cases.
Branch
A path created by following one split condition.
Terminal node
The final group, with its predicted class and class distribution.
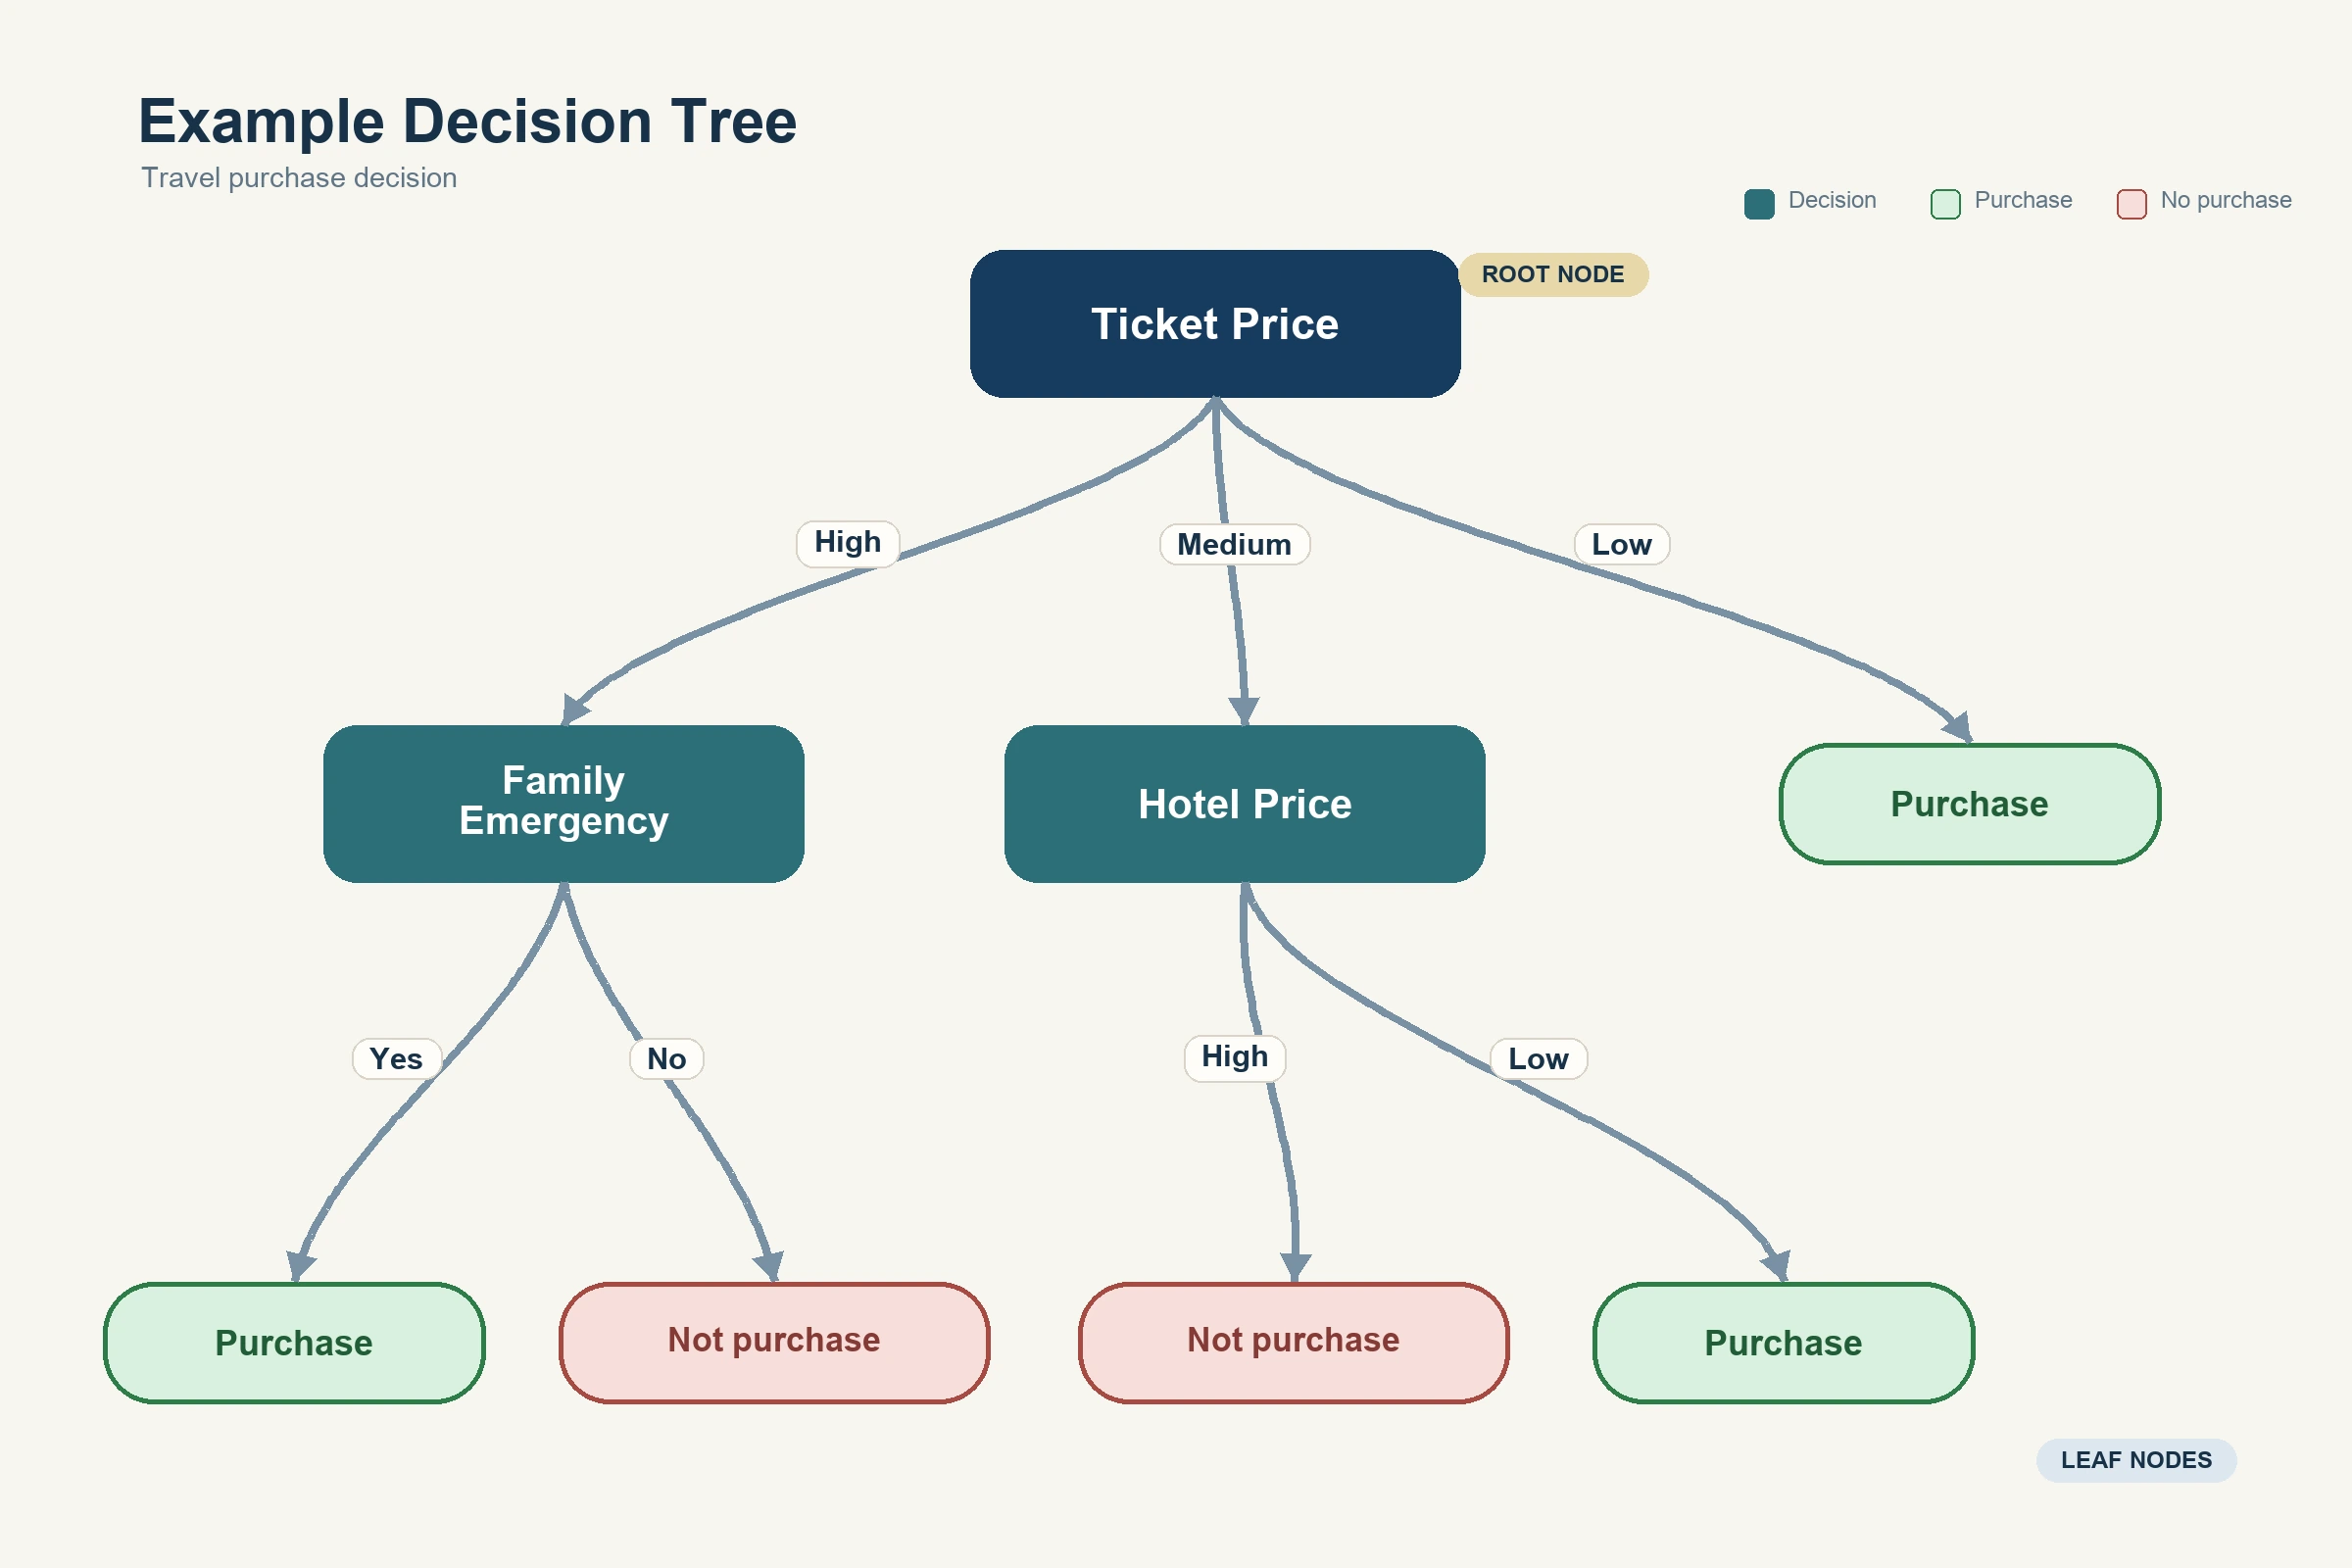
Visual 1: Decision-tree anatomy
What it shows: Begin at the root, apply the stated condition, and follow a branch until reaching a terminal prediction.
Connection to the lesson: These concepts determine what you inspect in the generated SPSS Modeler tree. In a report, translate only the most useful supported paths into plain-language rules; do not reproduce every branch.
Interpret carefully: an early split can be predictively useful without being a cause. Branches also depend on the available data, settings, sample, and competing predictors.
SPSS Modeler Software Steps
Build one baseline C&R Tree
Use this compact stream so every model decision is visible and reproducible. Dialog names can differ slightly by SPSS Modeler version.
Data source→Type→Partition→C&R Tree→Model nugget→Matrix + Evaluation
Import and inspect the data. Connect the appropriate source node and preview the fields, values, missingness, and category labels. Confirm that one row represents one case.
Set field roles in the Type node. Set Purchase as the Target and the candidate predictors as Inputs. Exclude identifiers, post-outcome fields, and any field that leaks the answer.
Create training and testing samples. Add a Partition node and use a documented split such as 70% training and 30% testing. Preserve the same random seed when comparing models. Consider stratification when the target categories are imbalanced.
Add the baseline tree. From the Modeling palette, connect a C&R Tree node after the Partition node. Verify the target and inputs before changing advanced settings.
Keep the first model readable. Retain reasonable stopping rules and pruning for the baseline run. Avoid maximizing depth merely to improve training accuracy.
Run and open the model nugget. Inspect the first split, major branches, terminal-node counts and percentages, and predictor importance.
Evaluate held-out cases. Connect a Matrix node and an Evaluation node to the generated model nugget. Read testing results separately from training results.
Save the evidence. Record the target, inputs, partition, tree type, pruning or complexity settings, one readable tree view, one important branch, predictor importance, and testing metrics.
Stop before running if any answer is No
The target has the intended categories and is not also an input.
Identifiers and post-outcome fields are excluded.
The partition occurs before the model node.
Training and testing cases receive the same preparation.
The model will be judged on held-out data, not training accuracy alone.
Understand and Interpret the Outputs
Read the evidence in the correct order
Do not begin with one attractive branch or the overall accuracy. First verify the model setup, then interpret the tree structure, inspect terminal-node evidence, review predictor importance, and finally judge performance on testing cases.
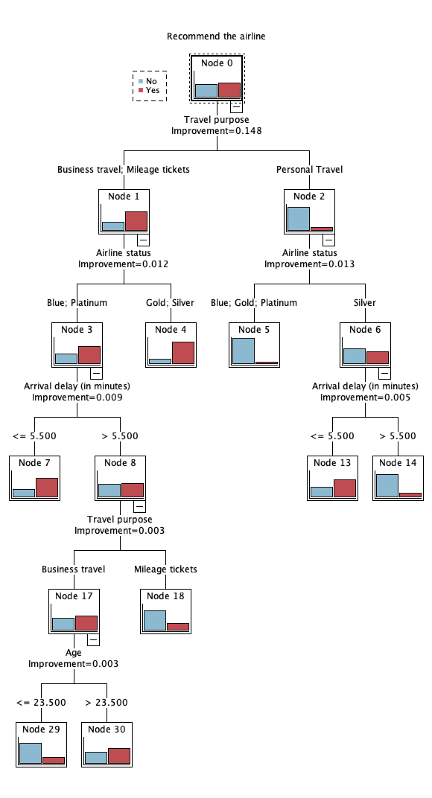
Visual 2: Generated tree output
What it means: the model selected travel purpose for the first split, then used other fields within major branches. The colored bars show the class distribution inside each node.
Connection to software and report: this is opened from the model nugget created in Step 6. Use a readable pruned view or one decision-relevant branch in the report, supported by node counts and testing performance.
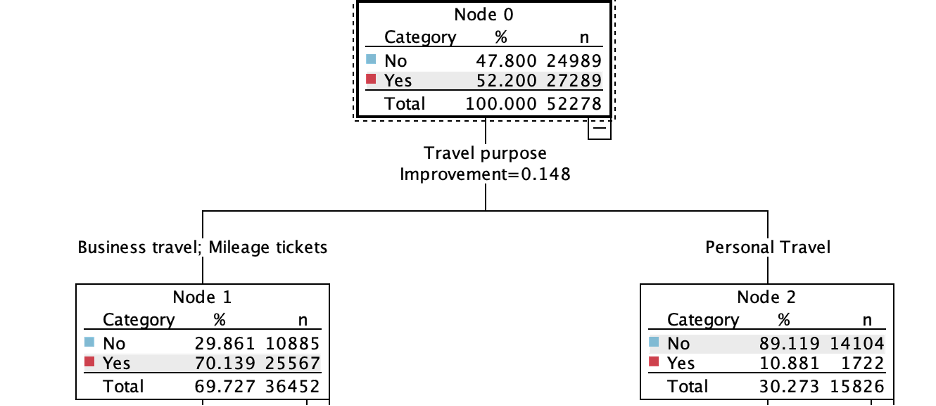
Visual 3: Node counts and outcome rates
What it means: at the root, 52.2% of 52,278 cases were purchasers. In the business-travel or mileage-ticket branch, 70.1% were purchasers; in the personal-travel branch, only 10.9% were purchasers.
Connection to output and report: counts protect you from reporting a dramatic percentage based on a tiny node. A useful report may describe this major split, but must still use testing evidence before claiming predictive value.
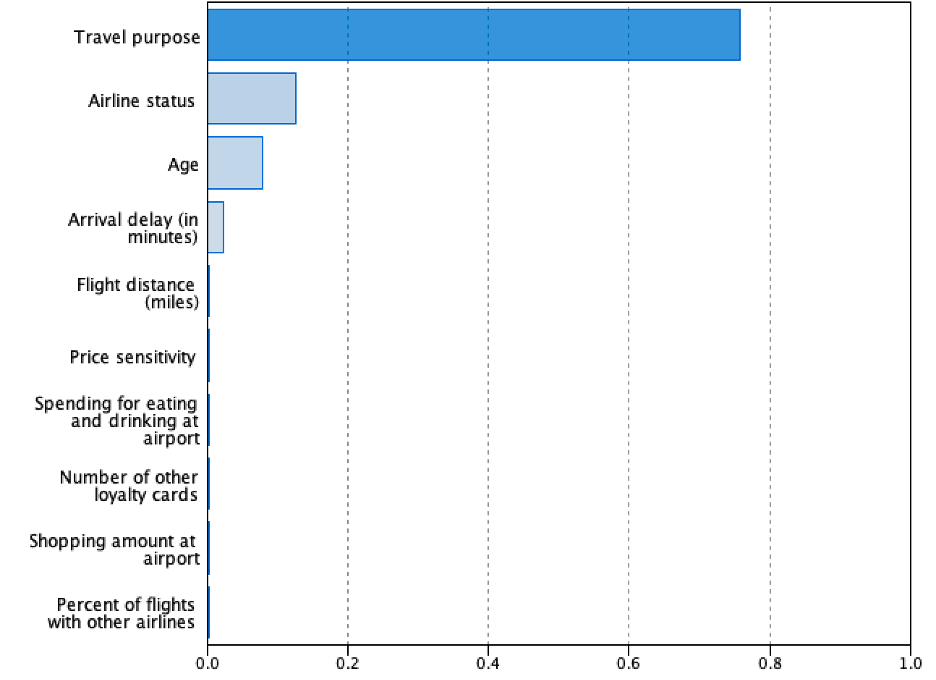
Visual 4: Predictor importance
What it means: travel purpose contributed most strongly to the fitted tree, followed by airline status and age. Importance is relative predictive contribution—not effect direction, statistical significance, or proof of causation.
Connection to the report: include the importance chart only when identifying the model's dominant predictors helps answer the project question. Pair it with readable branch evidence because importance alone does not show how a field separates cases.
Worked example: read a testing confusion matrix
The table below is an illustrative held-out result designed to show the calculation process. Replace these numbers with your own Matrix-node output.
Illustrative testing results, n = 200
Actual class
Predicted Purchase
Predicted No Purchase
What to notice
Purchase
60 true positives
20 false negatives
60 of 80 purchasers were identified: 75% sensitivity.
No Purchase
30 false positives
90 true negatives
90 of 120 non-purchasers were identified: 75% specificity.
Accuracy
(60 + 90) ÷ 200 = 75%
Purchase sensitivity
60 ÷ (60 + 20) = 75%
Purchase precision
60 ÷ (60 + 30) = 66.7%
No-purchase specificity
90 ÷ (90 + 30) = 75%
Whether this performance is useful depends on the baseline rate and the consequences of false positives and false negatives. If missing a purchaser is more costly than contacting a non-purchaser, sensitivity may matter more than overall accuracy.
Use in every report
Target and eligible predictors
Training/testing design
Tree algorithm and important settings
Held-out class-level performance
Use when relevant
Readable tree or selected branch
Node counts and outcome rates
Predictor importance
ROC or lift for comparison or targeting
Usually omit
Every branch of a large tree
Training-only metrics
Decorative screenshots
Outputs not discussed in the text
Stop and diagnose: reconsider the tree when testing performance drops far below training performance, important categories are missed, terminal nodes are very small, the tree is too complex to explain, or small data changes produce substantially different major branches.
Writing the Report
Turn the selected evidence into a results paragraph
Report enough information for a reader to understand the model, evaluate its evidence, and recognize its limitations. Do not list screenshots without interpreting them.
A [tree algorithm] model was used to predict [target] from [predictor set]. The data were divided into [training percentage] training and [testing percentage] testing samples, and [pruning/complexity setting] was used. The first split used [field and condition]. One decision-relevant terminal group contained [n] cases, of which [rate]% had [outcome]. On the testing sample, the model achieved [accuracy], with [sensitivity/recall] for [priority class] and [precision or specificity] of [value]. The model should be interpreted as predictive rather than causal, and its usefulness is limited by [class imbalance, small nodes, instability, or another relevant limitation].
Illustrative completed paragraph
A C&R Tree model was used to predict whether a traveler would make a purchase. The analysis used a training sample to build the tree and a held-out testing sample to evaluate it. Travel purpose produced the first split: the displayed tree showed a substantially higher purchase rate among business-travel or mileage-ticket cases than among personal-travel cases. In the illustrative testing matrix, the model achieved 75% accuracy, 75% sensitivity for purchasers, and 66.7% precision for predicted purchasers. These patterns indicate predictive association rather than causation, and the model should be compared with the baseline rate and evaluated for branch stability before operational use.
Quality Check
Common mistakes that weaken a tree analysis
Using the target, an identifier, or a post-outcome field as an input.
Preparing training and testing cases differently or allowing data leakage.
Choosing the deepest tree because it has the best training accuracy.
Reporting only overall accuracy while ignoring class-level errors.
Describing predictor importance as effect size, direction, significance, or causation.
Reporting a percentage without its terminal-node count.
Including a large unreadable tree without explaining the decision-relevant branch.
Practice Exercise
Apply the workflow to your own classification question
State the target and the two classes you want to predict.
List eligible predictors and remove identifiers or leakage fields.
Create and document a training/testing partition.
Run one baseline C&R Tree with readable stopping and pruning settings.
Save the first split, one meaningful branch, terminal-node counts, predictor importance, and testing matrix.
Write one paragraph using the reporting template and add one limitation.
What the Complete Module Adds
Continue from one baseline tree to a defensible model comparison
The full Decision Trees module expands this sample with C&R Tree, CHAID, C5.0, and QUEST comparisons; pruning and stopping-rule decisions; class imbalance, priors, and misclassification costs; training-versus-testing diagnostics; ROC, gain, and lift; stability and overfitting checks; champion-model selection; and extended report guidance.