SPSS Modeler for Non-Programmers | Module 1 | Lesson 2
Data Mining Process, Methods, and Software
Learn how CRISP-DM, SEMMA, supervised learning, unsupervised learning, and SPSS Modeler streams fit together in a practical project workflow.
Expanded lessonBeginner to advanced95 minutesFree Public Lesson
Lesson Overview
What this lesson teaches
This lesson turns the data mining process into a usable visual workflow. Learners connect project goals to CRISP-DM and SEMMA, understand target and input fields, distinguish supervised and unsupervised learning, and learn the basic SPSS Modeler language of streams, nodes, fields, and outputs.
Method category
Process and workflow
Best beginner use case
A learner is ready to move from general concepts into a repeatable project process and SPSS Modeler workflow.
Estimated time
95 minutes for the full lesson; 25 minutes for the quick-start path.
Workflow focus
CRISP-DM, SEMMA, field roles, target variables, supervised learning, unsupervised learning, and visual stream planning.
Learner levels
Beginner: understand the idea. Applied: use it in SPSS Modeler or a project. Advanced: defend decisions, limitations, and reporting choices.
Learning Path
Choose the level that matches your project
Use this lesson in layers. Start with the beginner path if the topic is new. Move into the applied and advanced sections when you need to complete a project, explain decisions, or write a stronger report.
Beginner
Understand the process
Learn why a data mining project needs stages instead of random tool use.
Applied
Build a stream plan
Translate a project question into data, field roles, nodes, modeling, evaluation, and reporting.
Advanced
Choose methods defensibly
Explain why supervised, unsupervised, association, or reporting workflows fit different project goals.
Learning Objectives
By the end of this lesson, you should be able to:
Describe the purpose of a validated data mining process.
Compare CRISP-DM and SEMMA in practical language.
Explain why this course uses a modeling-centered workflow.
Differentiate supervised and unsupervised learning.
Use target, input, field, node, stream, model, and output correctly.
Choose a general method family based on the project goal.
Plan a basic SPSS Modeler stream before building it.
Explain how process discipline improves reliability and report quality.
Beginner Quick Start
The process in 10 plain-language ideas
This section gives you the process map before you start connecting nodes in SPSS Modeler.
A process prevents random clicking. A data mining process gives you a sequence so your work can be repeated, explained, and improved.
CRISP-DM starts from the business problem. It moves from understanding the problem and data to preparation, modeling, evaluation, and deployment.
SEMMA is modeling-centered. It organizes work around sample, explore, modify, model, and assess.
SPSS Modeler uses streams. A stream is the visual workflow that connects data, preparation, modeling, output, and export nodes.
A node performs a task. Nodes read data, set field roles, transform records, build models, evaluate results, or create output.
Fields are variables. SPSS Modeler often uses the word field where many learners expect variable or feature.
The target is the outcome. Supervised learning needs a target field to predict.
Inputs are clues. Input fields are the predictors the model can use.
No target means a different method family. If there is no target, you may need clustering, PCA, association, or exploration.
Evaluation closes the loop. The process is not finished when a model runs. You must assess, compare, and explain results.
Core Concepts
Process terms and software terms
These terms appear throughout the rest of the course. Learn them now and later lessons become much easier.
CRISP-DM
A project lifecycle that emphasizes business understanding, data understanding, data preparation, modeling, evaluation, and deployment.
SEMMA
A data mining sequence focused on sampling, exploring, modifying, modeling, and assessing.
Stream
The visual SPSS Modeler workspace where nodes are connected into an analysis workflow.
Node
A visual tool in the stream. Each node performs a specific task, such as reading data, setting roles, modeling, or producing output.
Target field
The field the model is trying to predict in supervised learning.
Input field
A field used by the model as possible evidence for predicting or explaining the target.
Decision Guide
Which process or method family fits the project?
Use this table to decide what kind of workflow you are planning before choosing a specific algorithm.
Project goal
Likely workflow
First question to ask
Predict a category
Supervised classification
What is the target field and what are the categories?
Predict a number
Supervised numeric prediction
Is the target continuous and measured consistently?
Find natural groups
Unsupervised clustering
What fields describe similarity among cases?
Reduce many related fields
Dimension reduction
Are many fields measuring overlapping ideas?
Compare models
Model assessment workflow
Will every model use the same target, inputs, and partition?
Write results
Reporting workflow
Which outputs support each claim?
Practical rule: If you cannot name the target, you cannot choose a supervised model yet. If there is no target, choose an exploratory or unsupervised workflow instead.
Workflow Overview
A practical SPSS Modeler planning sequence
Goal
Data Source
Type Node
Explore
Modify
Sample
Model
Assess
The stream should reflect the logic of the project. A clean stream makes the final report easier to write because every decision has a visible place.
Before You Start
Plan the stream before building it
A few minutes of planning prevents field-role errors, unclear outputs, and weak reporting later.
Write the project goal in one sentence.
Decide whether the target field exists.
List fields that may be inputs.
Mark fields that should be excluded.
Choose whether the workflow is supervised or unsupervised.
Plan where sampling, exploration, preparation, modeling, and assessment occur.
Decide what output would convince you that the model is useful.
Step-by-Step Tutorial
Build a project workflow plan
Start with the project goal. State what the model or analysis should help someone understand or decide.
Identify the learning type. Choose supervised learning when there is a target; choose unsupervised learning when there is no target.
List field roles. Classify each field as target, input, record identifier, rejected, or unknown.
Sketch the stream. Draw the node sequence before building it: data, type, audit, preparation, partition, model, evaluation, report.
Choose the first method family. Select classification, prediction, clustering, association, dimension reduction, or reporting support.
Name evaluation evidence. Decide whether accuracy, error, ROC, lift, cluster profile, component structure, or written interpretation matters most.
Build in SPSS Modeler. Create the stream in the same order as the plan and keep labels clear.
Document the process. Record the decisions you made so they can be explained in the methodology or report section.
SPSS Modeler Software Steps
Build a visible data mining process stream
Use the stream as a process map. Each node should represent one step in the project logic so learners can see how the data mining process becomes software work.
Highlighted labels identify SPSS Modeler nodes or tools learners should add, open, or connect in the stream. Output names and evaluation metrics are left unhighlighted unless they are actual nodes. Menu and node names follow IBM SPSS Modeler 19 terminology.
Create the project stream skeleton Click path: Start a new stream and add a source node from the Sources palette. Name or label the stream with the project question before adding models. What to check: The canvas should make the project goal visible before method selection begins.
Add field-role review Click path: Drag a Type node from Field Ops after the source node. Open it and set obvious identifiers to None or Record ID, possible predictors to Input, and any known outcome to Target. What to check: The Type node becomes the software checkpoint for roles, measurement levels, and target definition.
Add an exploration checkpoint Click path: Place a Data Audit node from the Output palette after the Type node and run it. Use the output to identify missing values, unusual values, and fields needing preparation. What to check: Do not move to modeling until the audit output has been reviewed.
Add preparation and partition nodes Click path: Use Field Ops or Record Ops nodes such as Filter node, Select node, Derive node, Filler node, Sample node, or Partition node only when the project requires them. What to check: The stream should show preparation before modeling. A Partition node should appear before supervised model nodes when evaluation is needed.
Add model and evaluation nodes Click path: From the Modeling palette, add the planned model node. From the Output or Graphs palette, add an Analysis node, Evaluation node, Matrix node, Table node, or chart nodes as appropriate. What to check: The complete stream should show the path from source data to evaluation evidence and reporting outputs.
Document the process in the stream Click path: Use node names, stream annotations, or a separate project log to label the purpose of each major node group. What to check: A reviewer should be able to understand the process by reading the stream from left to right.
Configuration checklist
Use this table while opening node dialogs. Start with the recommended choice, then change only when the project question or validation evidence gives a reason.
Node or tab
Setting to select
Recommended starter choice
When to change it
Type node / Roles
Target, Input, None, or Record ID
Use Target only for the outcome field; set valid predictors to Input and reject IDs or leakage fields.
Change roles when switching from supervised prediction to exploration or when a field leaks the answer.
Data Audit node
Fields included in the audit
Audit the target and all candidate inputs on the first pass.
Narrow the audit after obvious rejected fields have been removed.
Filter node
Fields kept for modeling
Keep the target, defensible inputs, and only the IDs needed for tracking.
Remove duplicate, post-outcome, or irrelevant fields before model comparison.
Partition node
Training and testing split
Use a simple 70/30 or 80/20 split with a fixed random seed.
Add validation or revise the ratio for small datasets, class imbalance, or assignment requirements.
Modeling palette
First model node selected
Choose the node family that matches the project purpose and target type.
Change the model family after exploration shows a different outcome type or method need.
Output nodes
Evidence used for assessment
Use Analysis, Matrix, Evaluation, Table, or charts based on the target and reporting question.
Change the output node when accuracy, error, ROC, lift, or profile evidence is more appropriate.
These visuals are arranged in the order learners use them. Begin with the idea, match it to the SPSS Modeler action, read the resulting evidence, and decide whether that evidence belongs in the report. The variables and values shown in software outputs are intentionally preserved so the explanation matches the screen.
Use the method guide and measurement guide before selecting nodes. They connect the project question and field meaning to an appropriate analysis family.
ConceptLearning aid
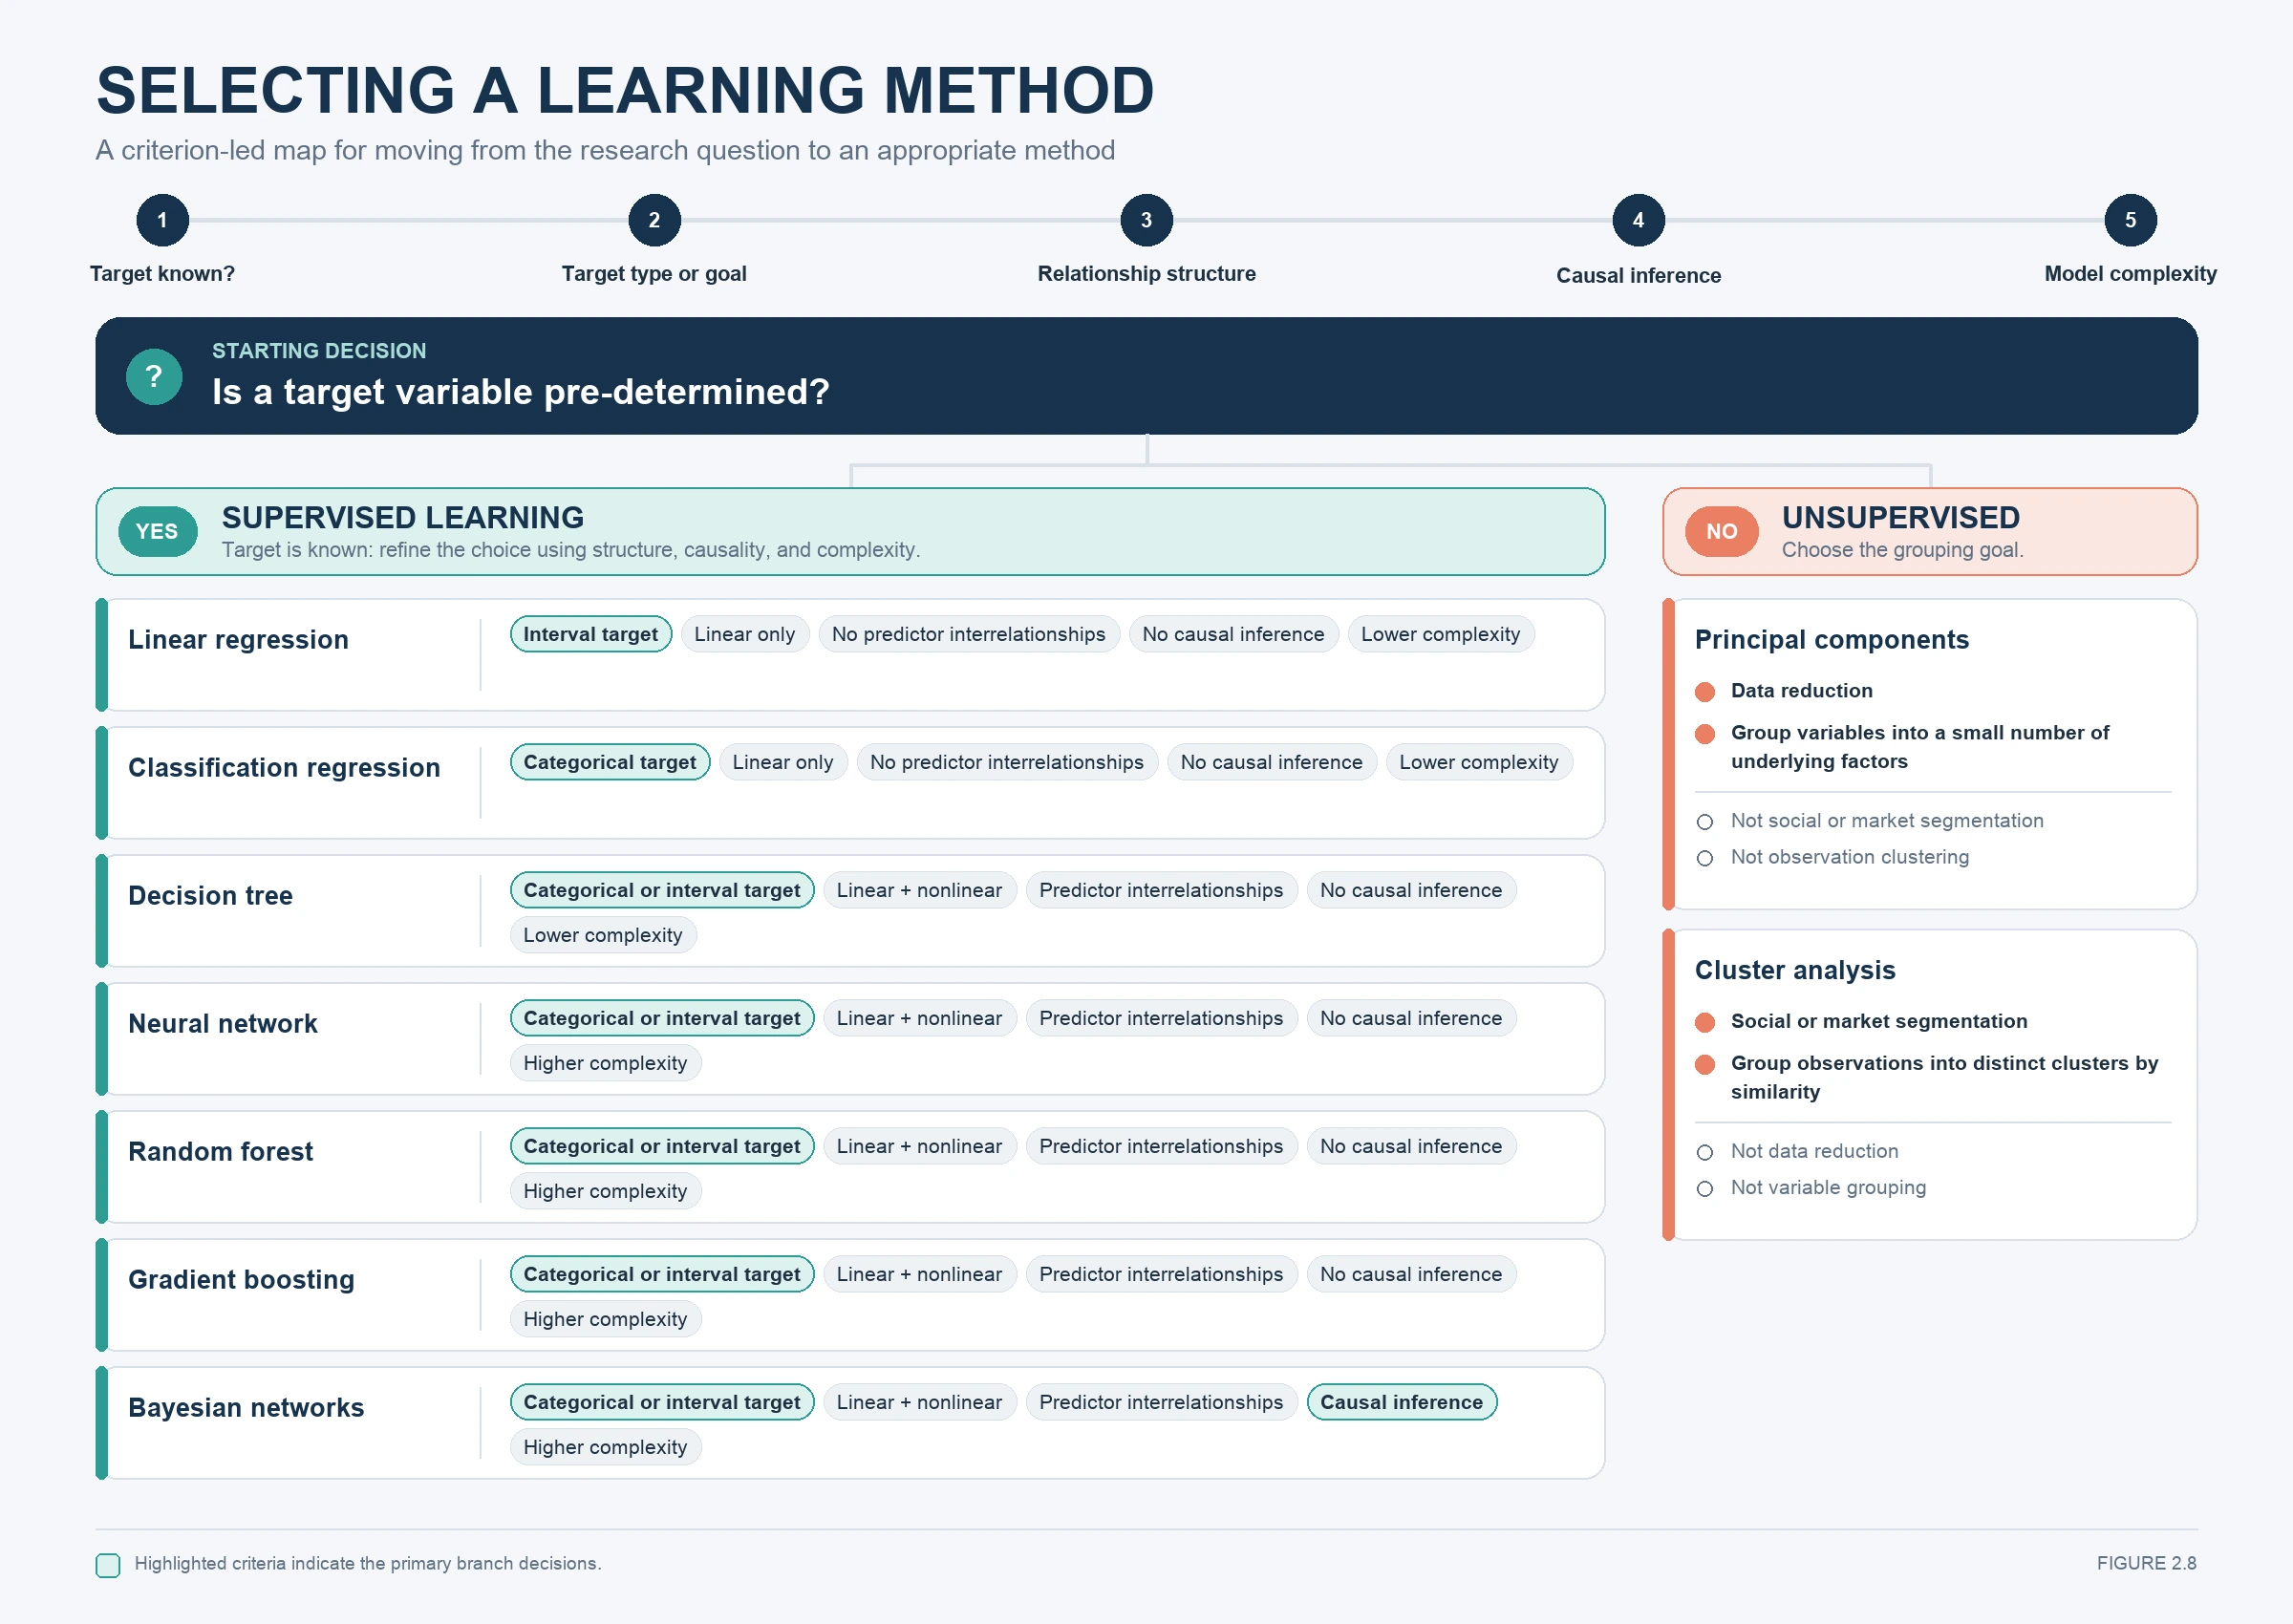
Learning-method decision guide
What this visual shows: Use before choosing a model: This visual is a method-decision table; use it to justify why the selected model or analysis output matches the business question.
What to inspect: Match the question, target type, learning type, and desired output to the method family before opening a model node.
Connection and report use: Connect this to the Core Concepts on CRISP-DM, supervised versus unsupervised learning, field roles, and method selection from the project question and use it to justify the left-to-right Source → Type → Audit → Preparation → Partition → Model → Evaluation stream. It is a learning or methods visual, not a model result.
ConceptLearning aid
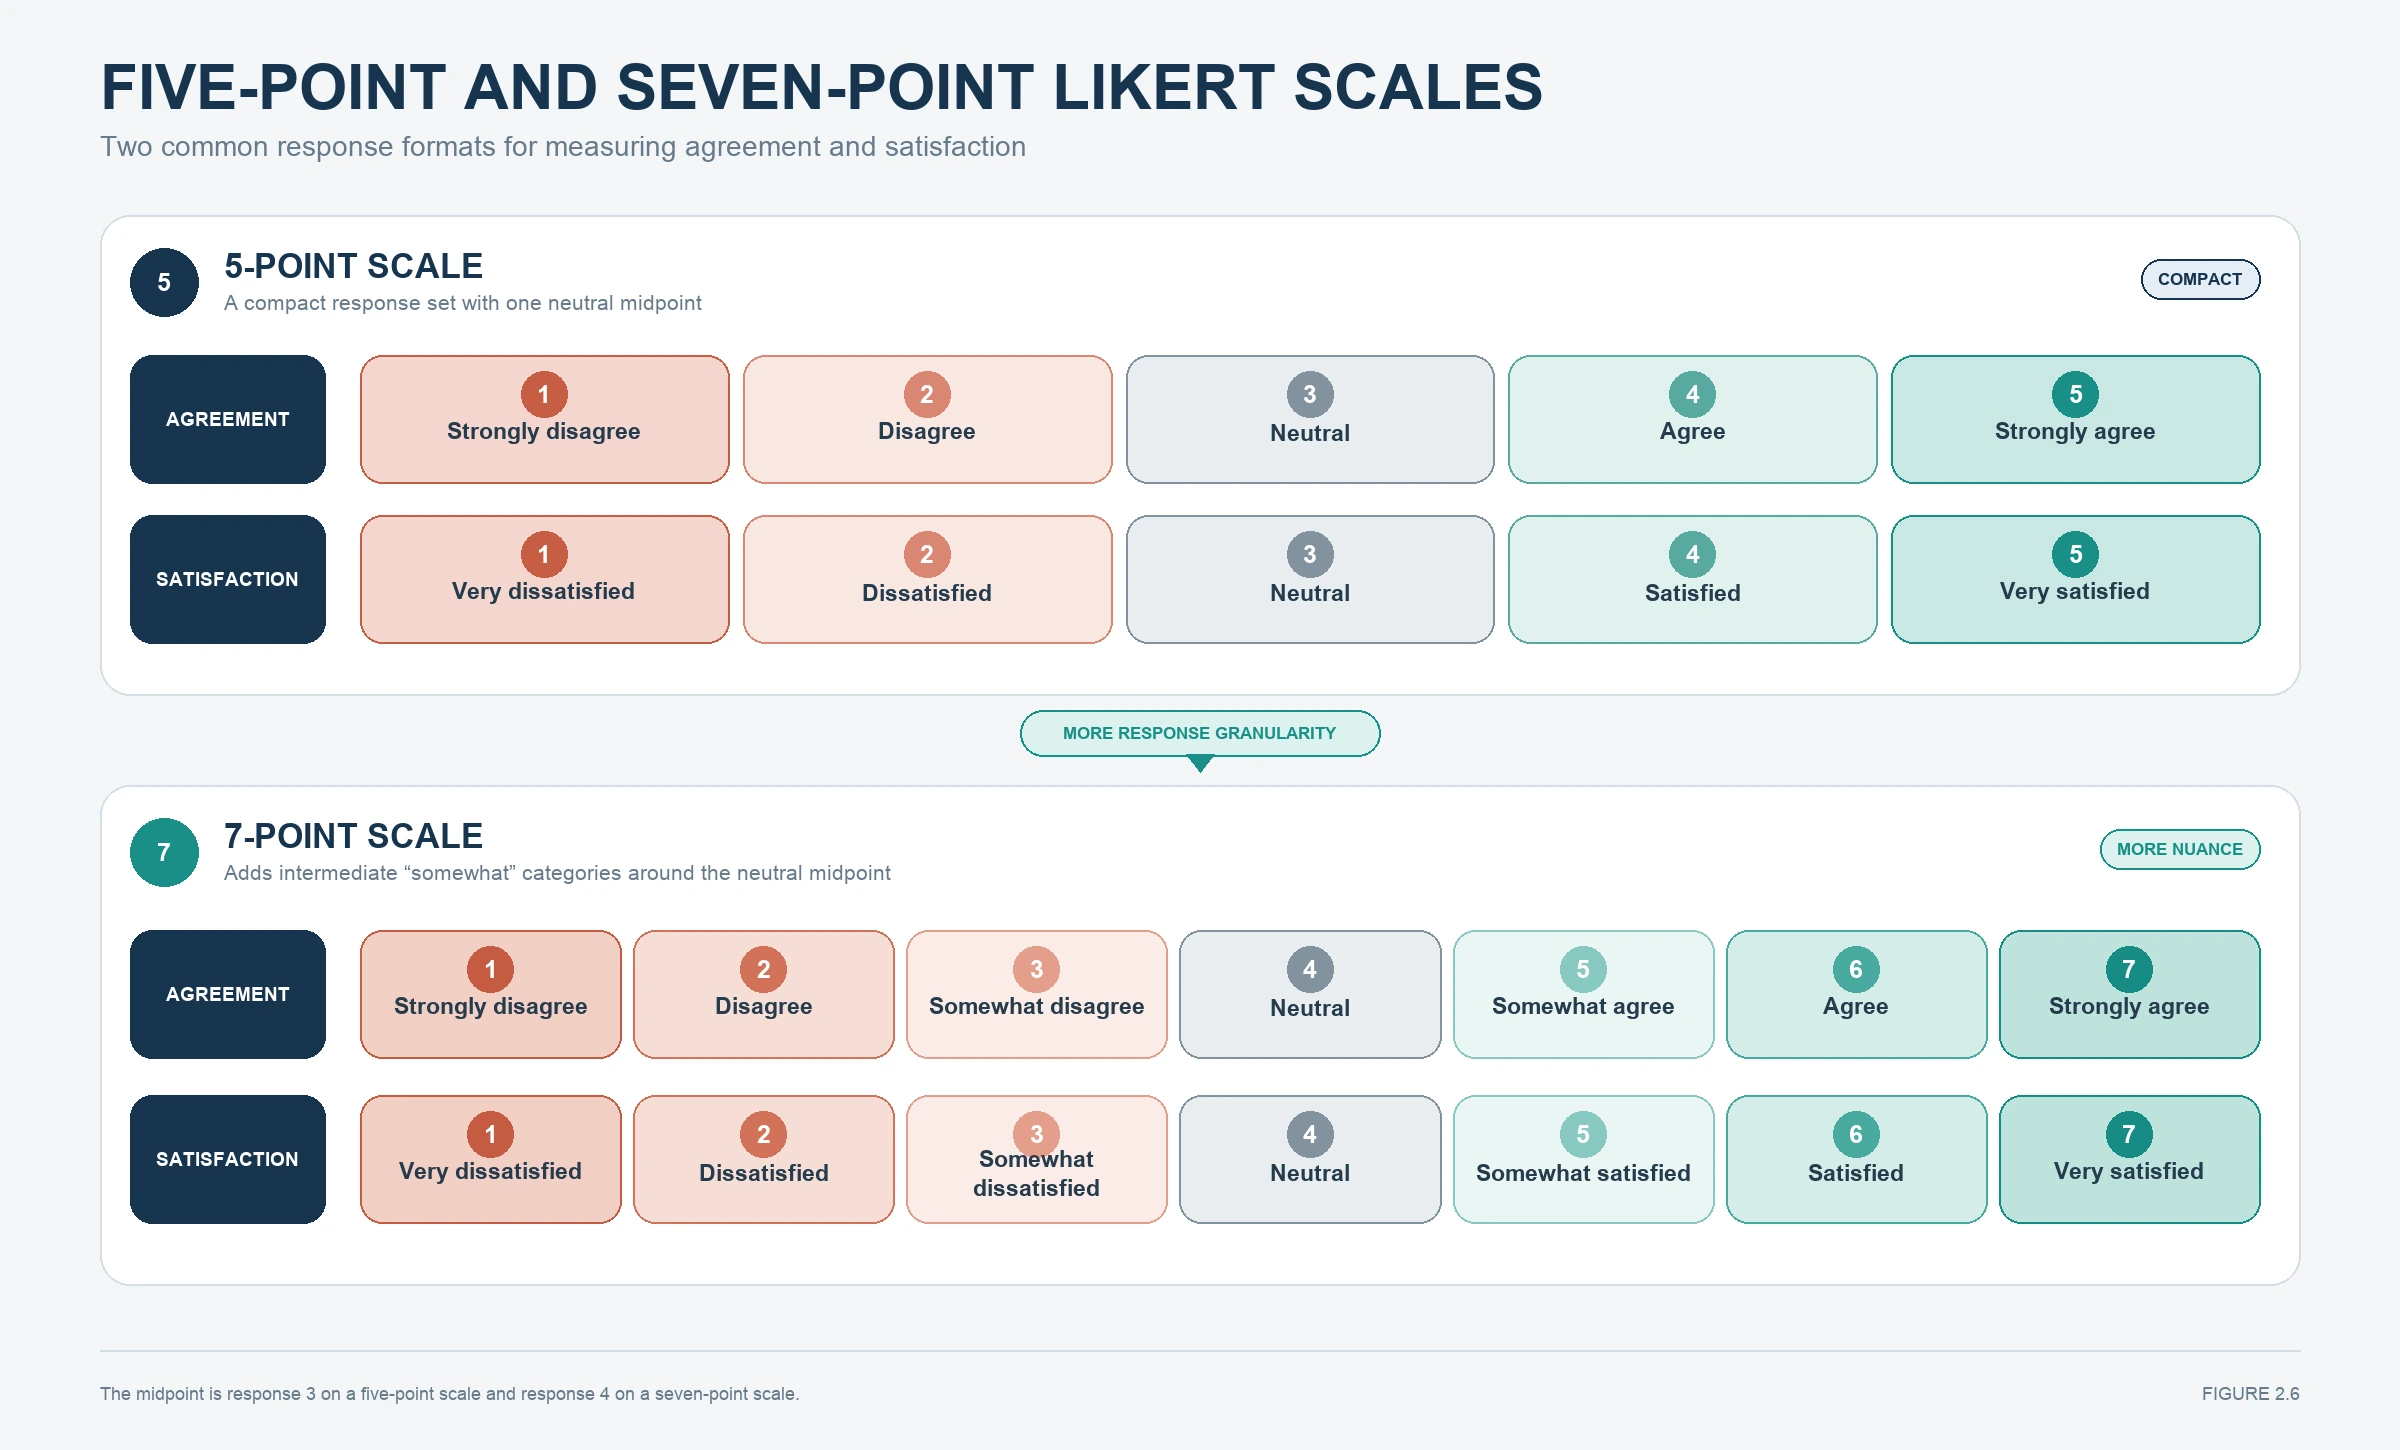
Measurement levels for Likert scales
What this visual shows: Use the Likert-scale guide when assigning measurement levels; numeric storage alone does not make a field continuous.
What to inspect: Match the level to what values mean, not how they are stored; ordered categories do not automatically become continuous measurements.
Connection and report use: Connect this to the Core Concepts on CRISP-DM, supervised versus unsupervised learning, field roles, and method selection from the project question and use it to justify the left-to-right Source → Type → Audit → Preparation → Partition → Model → Evaluation stream. It is a learning or methods visual, not a model result.
2
2. Build the process in SPSS Modeler
Use these interface and stream views to locate the tools, arrange the canvas, and verify that preparation and assessment occur in the correct order.
SoftwareMethods evidence
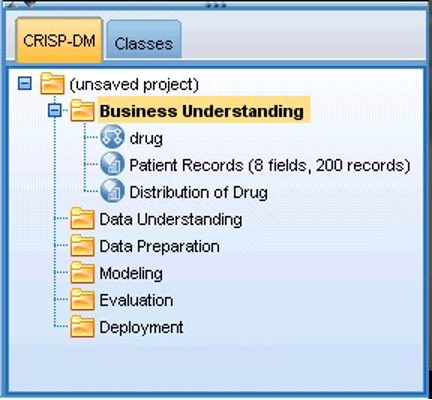
CRISP-DM project view
What this visual shows: This visual shows the CRISP-DM project view; match the stream work to the project phase before adding more nodes.
What to inspect: Read the nodes left to right and verify that source, role review, audit, preparation, partition, model, and evaluation appear in a defensible order.
Connection and report use: Match this visual to the left-to-right Source → Type → Audit → Preparation → Partition → Model → Evaluation stream. It verifies how the analysis was set up; describe the material choice in Methods rather than presenting the screenshot as a finding.
SoftwareMethods evidence
SPSS Modeler palettes and stream direction
What this visual shows: This visual shows the SPSS Modeler node palettes and stream direction; use it to locate source, field, model, and assessment tools.
What to inspect: Read the nodes left to right and verify that source, role review, audit, preparation, partition, model, and evaluation appear in a defensible order.
Connection and report use: Match this visual to the left-to-right Source → Type → Audit → Preparation → Partition → Model → Evaluation stream. It verifies how the analysis was set up; describe the material choice in Methods rather than presenting the screenshot as a finding.
SoftwareMethods evidence
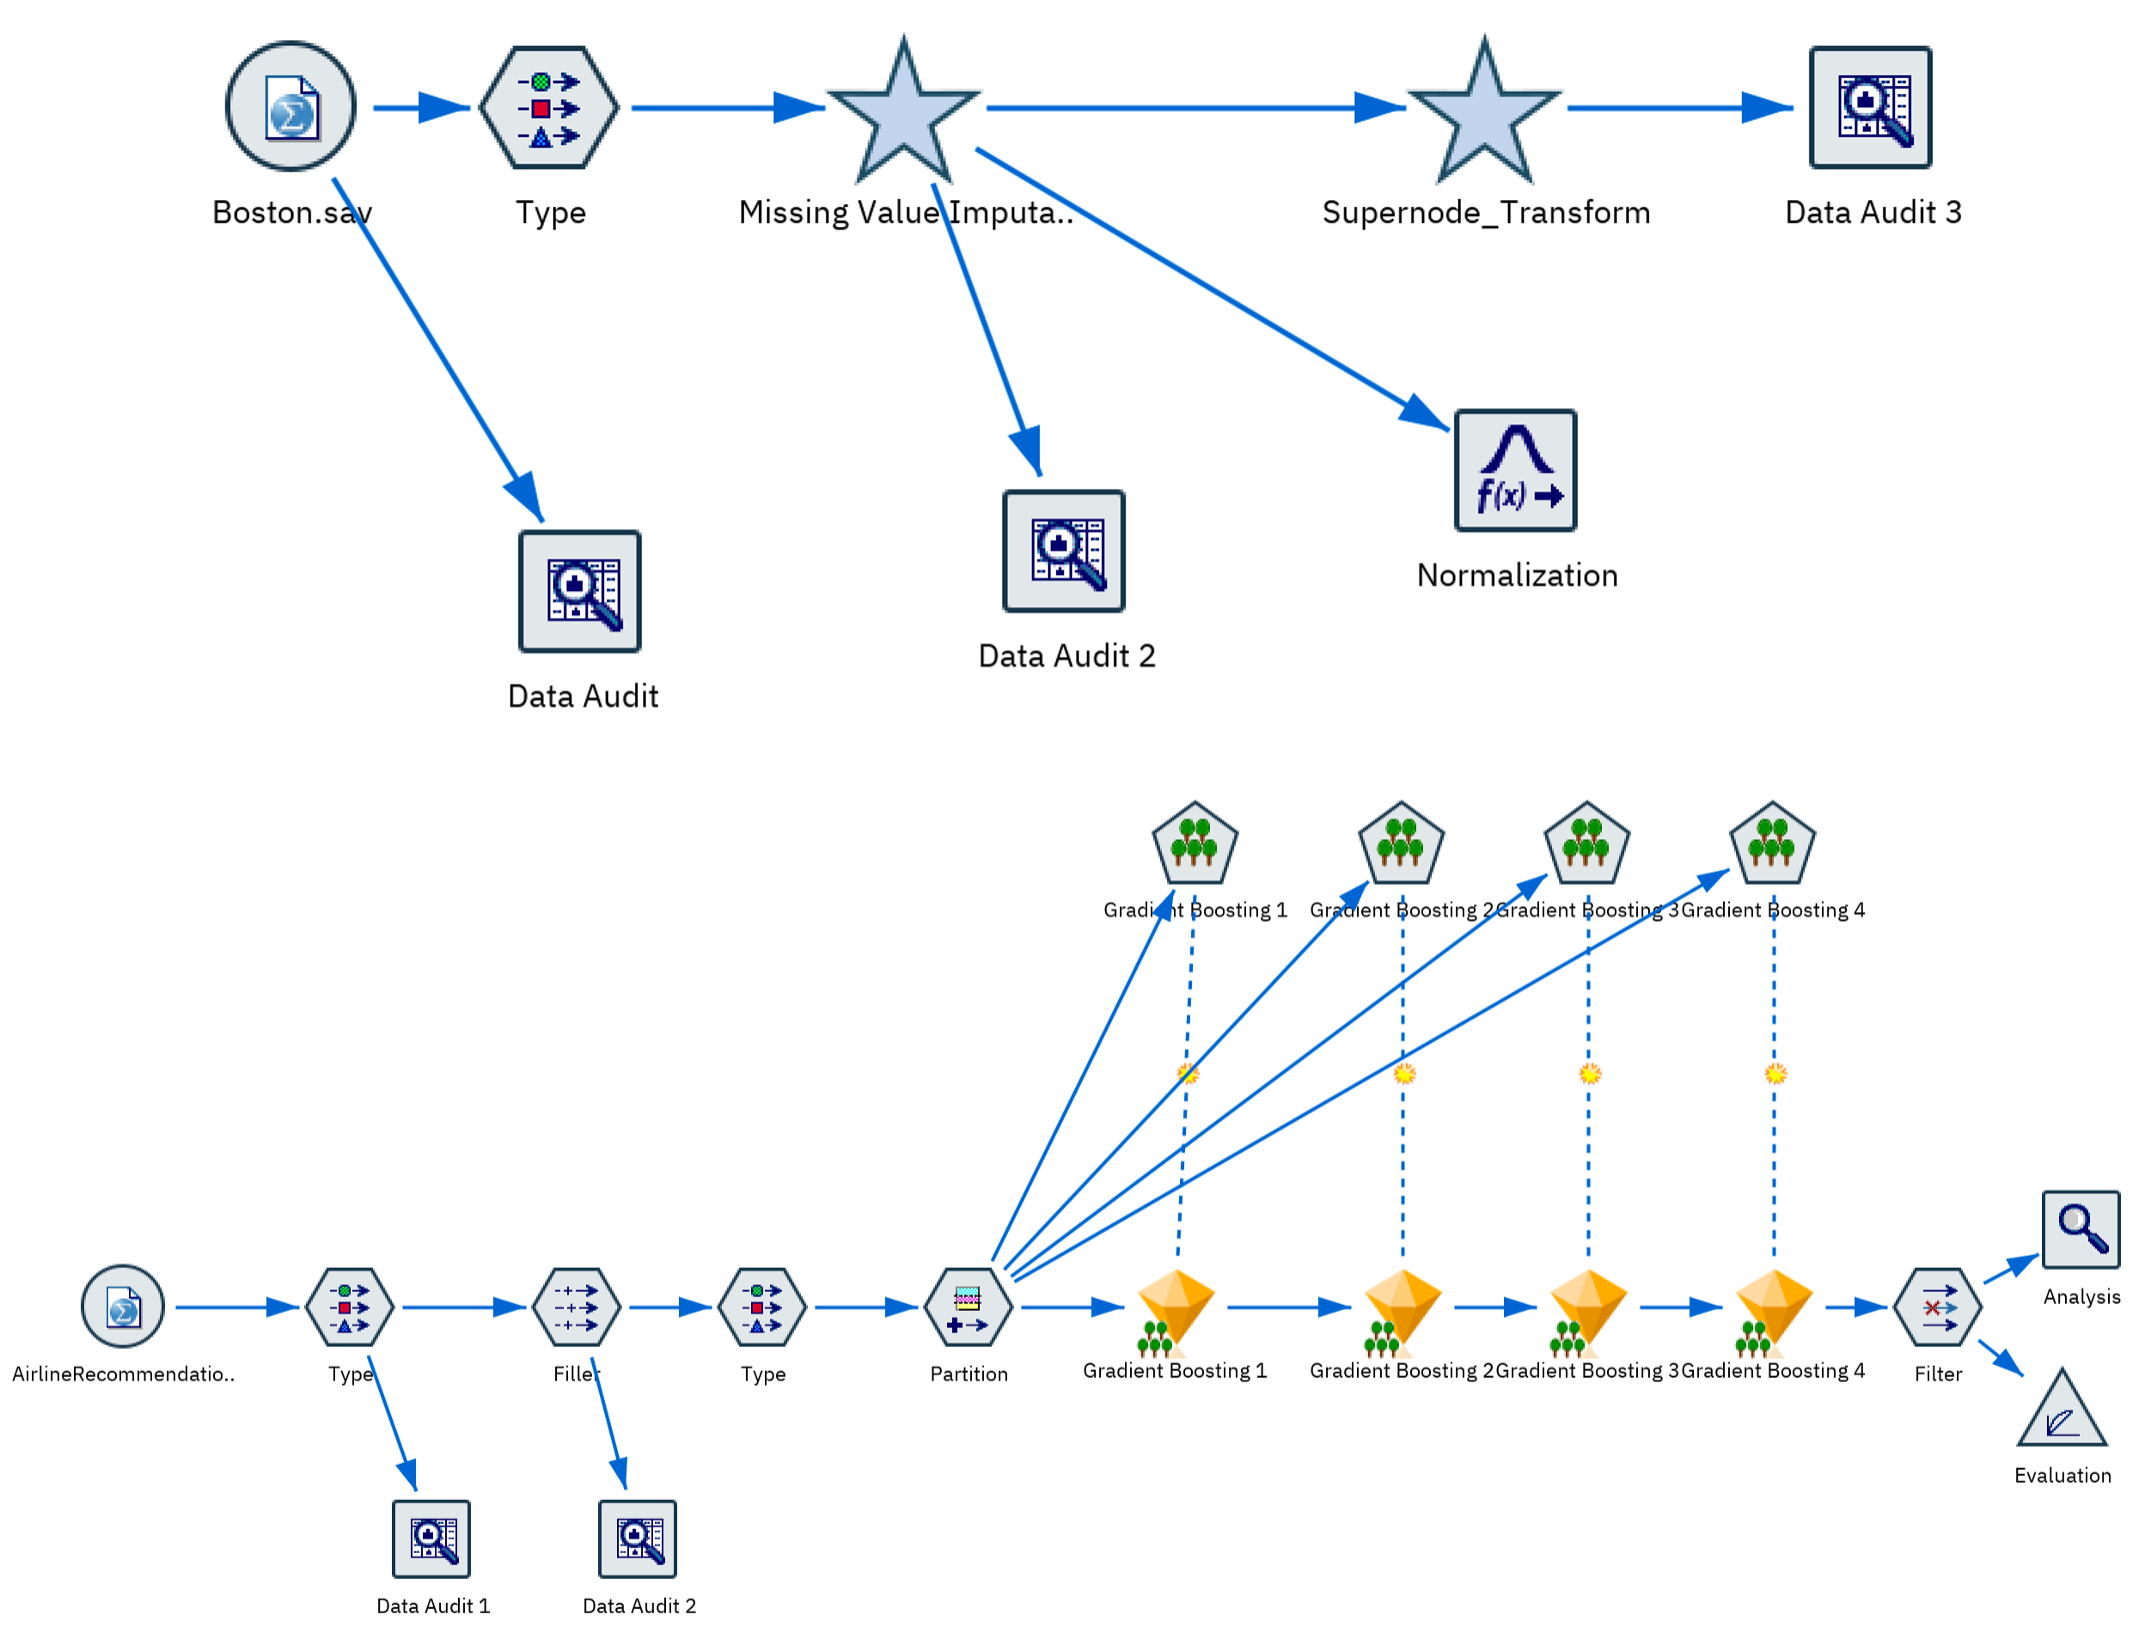
Complete stream examples
What this visual shows: This visual shows complete example streams; compare the canvas layout with this before interpreting outputs.
What to inspect: Read the nodes left to right and verify that source, role review, audit, preparation, partition, model, and evaluation appear in a defensible order.
Connection and report use: Match this visual to the left-to-right Source → Type → Audit → Preparation → Partition → Model → Evaluation stream. It verifies how the analysis was set up; describe the material choice in Methods rather than presenting the screenshot as a finding.
Visual-use rule: Concept diagrams help you understand or justify a method. Interface screenshots verify setup. Output charts and tables may become report evidence only when they answer the project question, come from the correct sample or partition, and are explained in words.
Understand and Interpret the Outputs
How to read the Data Mining Process, Methods, and Software outputs
Do not move directly from Run to Report. Use this sequence to decide what the software found, whether the result is trustworthy, and which evidence is useful enough to keep.
1
Verify the basis
Confirm the dataset, analytic unit, target or pattern, field roles, preparation, sample, and partition behind the output.
2
Read the main result
Name the statistic, pattern, category, component, cluster, rule, or probability in plain language before judging whether it is good.
3
Inspect diagnostics and limits
Check class-level errors, residuals, sample sizes, stability, assumptions, quality measures, comparison baselines, and any sign of leakage or overfitting.
4
Make the report decision
Keep an output only when it answers the project question, comes from the correct evidence base, adds information, and can be explained with an appropriate limitation.
Output
What it means
What to inspect and decide
Use in the report
Project/process view
Shows the current CRISP-DM phase and the deliverables expected before moving forward.
Confirm that the goal, analytic unit, target or pattern, success criterion, and audience are explicit.
Use when relevantUse the process framework briefly in Methods; report decisions and deliverables, not a generic process definition.
Type node roles and measurement
Translates the project question into Target, Input, Record ID, or None roles and valid measurement levels.
Look for IDs used as predictors, target leakage, category codes treated as continuous, and an outcome whose timing does not match prediction time.
Use when relevantUse a field-role table when it helps readers reproduce the analysis.
Data Audit and preparation log
Records the issues found and the actions taken before modeling.
Compare pre- and post-preparation counts, missingness, ranges, derived fields, and removed records or fields.
Use when relevantReport material preparation decisions with reasons; omit routine clicks.
Partition summary
Shows how cases were allocated for training, testing, and, when used, validation.
Check counts, percentages, target balance, fixed seed, and whether all candidate models use the same partition.
UseAlways report the split and evaluation sample for predictive work.
Model and evaluation artifacts
Provide the evidence used to compare candidate methods and select a final model.
Read the target-appropriate metric on held-out data, class-level or error diagnostics, and the gap between training and testing.
Use when relevantUse a small comparison table and one decision-relevant diagnostic, not every generated output.
Stop and diagnose when...
Return to an earlier process phase when the model does not answer the stated question, roles or measurement levels are wrong, preparation is undocumented, candidate models use different partitions, or the selected metric does not represent project success.
Evidence worth keeping
A process statement linking the question to the chosen method family
A reproducible preparation and partition summary
A held-out model comparison tied to the success criterion
From Output to Report
Use this writing pattern
The project followed an iterative data-mining process in which [question] was translated into [target/pattern and analytic unit]. After [key audit and preparation decisions], the data were divided into [partition design]. Candidate [model families] were compared using [held-out metric], and [selected model or next action] was chosen because [decision-relevant evidence].
Writing rule: Name the evidence first, interpret it second, state a limitation third, and make a recommendation only when the evidence supports one.
Worked Example
Planning a supervised learning stream
This example shows how a project goal becomes an SPSS Modeler stream plan.
Planning item
Example
Goal
Predict whether a customer will respond to an offer.
Learning type
Supervised classification because the target has response categories.
Target
Offer_Response: responded or did not respond.
Inputs
Prior purchases, tenure, recent activity, service plan, and campaign history.
Rejected fields
Customer ID, name, and fields that reveal response after the campaign.
Stream plan
Data source, Type node, Data Audit, Filter, Partition, classification model, evaluation output, report.
Example interpretation:
A good stream plan describes both the analytic goal and the software sequence. The learner can explain why each node exists, which fields are used, and how the final output will be judged.
Learning Checkpoints
Pause and test your understanding
Use these checkpoints before moving to the practice exercise.
Process check
Can you explain why the workflow begins with the problem rather than the model node?
Learning type check
Can you decide supervised versus unsupervised from the presence or absence of a target?
SPSS terms check
Can you explain fields, nodes, streams, target, and inputs?
Report check
Can you describe how the stream decisions will appear in the methodology section?
Advanced Layer
Process decisions that affect model trust
Advanced users should treat process design as part of model quality. Poor workflow design can make strong-looking output unreliable.
Decision
Why it matters
Advanced check
Report language
Field-role discipline
Wrong roles can make the model meaningless.
Audit target, inputs, rejected fields, and leakage risks.
The target and input roles were reviewed before modeling.
Process alignment
Different processes emphasize different project goals.
Use CRISP-DM for broad business lifecycle and SEMMA for modeling-centered analysis.
The workflow followed a structured data mining process.
Method family choice
A mismatch creates confusing outputs.
Choose supervised only when a target exists.
The method was selected because the project goal involved...
Stream documentation
Unlabeled streams are hard to reproduce.
Label major nodes and record decisions.
The analysis sequence included...
Evaluation planning
Metrics should be chosen before model shopping.
Define success before comparing models.
Model performance was evaluated using...
Common Mistakes
Problems to avoid
Choosing a model before the goal
This makes the workflow tool-driven instead of problem-driven.
Ignoring field roles
A model cannot be trusted if target, input, and rejected fields are not checked.
Treating all learning as supervised
Unsupervised projects do not have a target and require different interpretation.
Skipping assessment
A model that runs is not automatically useful.
Overloading the stream
Too many unnecessary nodes make the analysis hard to explain.
Not documenting decisions
A report becomes weak when the workflow choices cannot be reconstructed.
Project Quality Gate
Confirm the workflow matches the project goal
Use this checkpoint before treating the lesson as complete for a real assignment, research project, business analysis, or professional report.
Check 1
The project follows a clear process from understanding the problem through data, modeling, evaluation, and reporting.
Check 2
The SPSS Modeler stream has a planned sequence rather than disconnected nodes.
Check 3
The selected method family matches the target type or unsupervised goal.
Check 4
The final deliverable is known: classification, numeric prediction, segmentation, dimension reduction, probability explanation, or report support.
Evidence to save
A stream plan showing source, type, audit, preparation, partition, model, evaluation, and report output steps.
Report standard
Explain the overall process so readers understand how the project moved from question to evidence.
The process paragraph explains how the project moved from question to data preparation, modeling, and assessment.
Beginner version:
The analysis followed a structured data mining workflow. The project goal was to [goal]. The stream included data review, field-role setup, preparation, modeling, and evaluation so the model output could be interpreted carefully.
Advanced version:
The project was organized using a structured data mining process to align the analytic goal, field roles, preparation steps, model family, and evaluation evidence. This process improves reproducibility because each stream component supports a specific decision in the analysis.
Report part
What to include
Sentence starter
Goal
State what the workflow is designed to answer.
The workflow was designed to...
Data role setup
Mention target and input review.
Field roles were reviewed so that...
Process sequence
Summarize the major stages.
The stream included...
Assessment
Name how outputs were judged.
The model was assessed using...
Draft paragraph will appear here.
Practice Exercise
Design a stream before opening the software
Choose a project question. Use a real assignment, research idea, or business problem.
Mark the learning type. Write supervised, unsupervised, comparison, or reporting support.
Identify field roles. Name the target if it exists, likely inputs, and fields to exclude.
Sketch the node sequence. Use at least data source, type, audit, preparation, model, assessment, and report.
Choose evidence. Name the output that would make the result convincing.
Write the process paragraph. Explain why each stage appears in the workflow.
Self-check
If you cannot explain why each planned node appears in the stream, simplify the workflow before modeling.
Project Pathways
How to adapt this lesson to your own goal
Class assignment
Focus on correctly using process vocabulary and building a readable stream.
Research project
Focus on reproducibility, field-role decisions, and method-family justification.
Business project
Focus on the decision supported by the model and the evidence needed for action.
Reflection and Feedback Prompts
Questions to strengthen your workflow
Help me decide whether my project is supervised or unsupervised.
Turn my project question into an SPSS Modeler stream plan.
Check whether my target and input fields make sense.
Explain CRISP-DM and SEMMA in simple terms.
Help me write a methodology paragraph for my stream.
Identify possible leakage fields in my planned workflow.
Lesson Summary
Key takeaways
Structured process makes data mining work explainable and repeatable.
CRISP-DM and SEMMA are practical ways to organize projects.
SPSS Modeler uses streams, nodes, and fields to build visual workflows.
Supervised learning requires a target field.
The workflow should be documented so the report can defend each decision.